![]()
![]()
Rduinoiot provides an easy way to connect to Arduino Iot Cloud API with R. Functions allow to exploit API methods for many purposes, manage your Arduino devices and dashboards and access to the data produced by sensors and sketches. This is not an official library by Arduino.
You can install the development version of Rduinoiot from GitHub with:
# install.packages("devtools")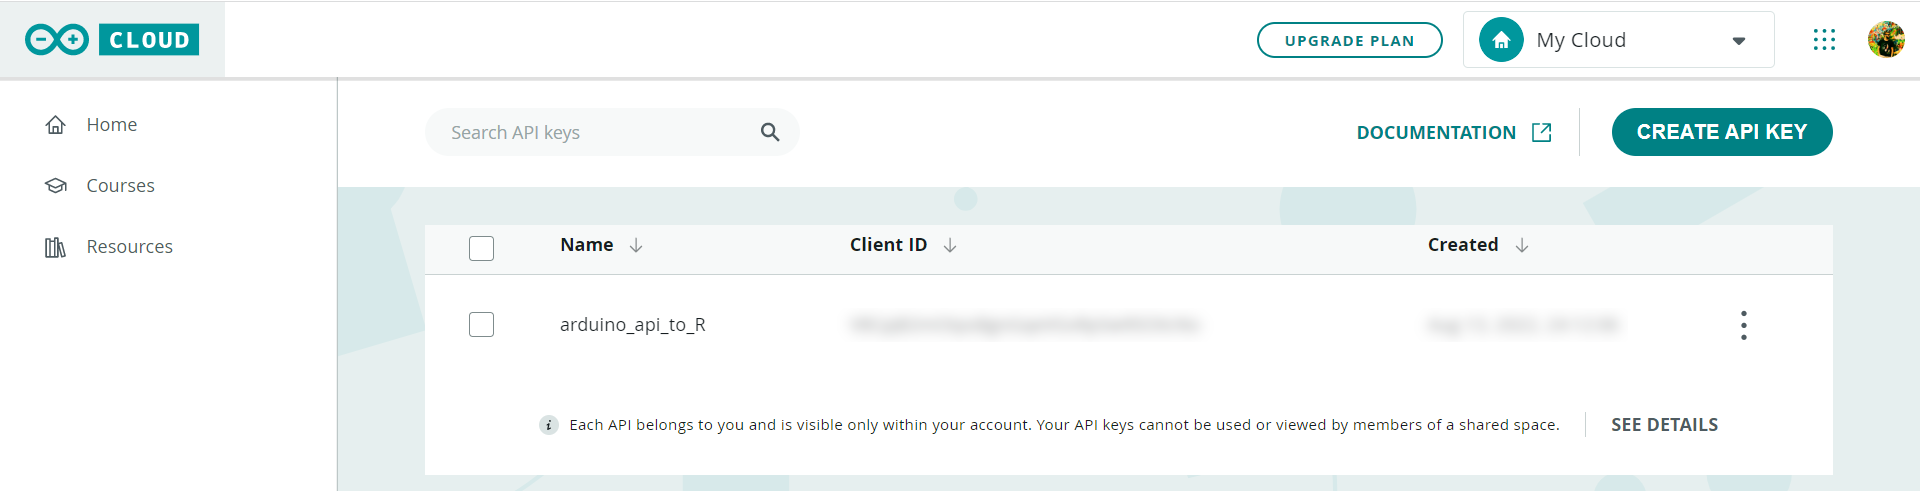
devtools::install_github("FlavioLeccese92/Rduinoiot")In order to access the API methods you need to create an API key.
This can be done by logging into your Arduino Cloud account and going to
the page https://cloud.arduino.cc/home/api-keys/ and
retrieve corresponding ARDUINO_API_CLIENT_ID and
ARDUINO_API_CLIENT_SECRET.
library(Rduinoiot)
# Sys.setenv(ARDUINO_API_CLIENT_ID = 'INSERT CLIENT_ID HERE')
# Sys.setenv(ARDUINO_API_CLIENT_SECRET = 'INSERT CLIENT_SECRET HERE')

create_auth_token()
#> v Authorization succeededThings associated to the user account can be easily accessed using
things_list(). This function will return detailed
information, in particular things_id which are needed to
access to properties.
tl = things_list()
#> v Method succeeded| created_at | href | id | name | properties_count | sketch_id | timezone | updated_at | user_id | device_fqbn | device_id | device_name | device_type |
|---|---|---|---|---|---|---|---|---|---|---|---|---|
| 2022-08-12 13:49:43 | /iot/v1/things/0b18eba2-2aba-4740-8bec-5043403ecdd9 | 0b18eba2-2aba-4740-8bec-5043403ecdd9 | Smart Garden | 8 | 7a8e48be-e77d-401c-8ef7-05bd6e7b4c27 | America/New_York | 2022-08-12 18:23:38 | fd39fa13-cbac-49ac-9316-cbdf452ba1c9 | NA | NA | NA | NA |
| 2022-08-12 18:24:07 | /iot/v1/things/60ef7770-90c0-4068-ac3d-8a2301c3ac3d | 60ef7770-90c0-4068-ac3d-8a2301c3ac3d | Home Security Alarm | 7 | 87cbfdec-b965-4a04-814a-232f65ac2f8e | America/New_York | 2022-08-12 18:42:09 | fd39fa13-cbac-49ac-9316-cbdf452ba1c9 | NA | NA | NA | NA |
| 2022-08-12 21:57:28 | /iot/v1/things/b6822400-2f35-4d93-b3e7-be919bdc5eba | b6822400-2f35-4d93-b3e7-be919bdc5eba | Personal Weather Station | 5 | 0ef1dc12-dd8f-477e-963a-f7734b5ff141 | America/New_York | 2022-08-12 21:59:46 | fd39fa13-cbac-49ac-9316-cbdf452ba1c9 | arduino:samd:mkrwifi1010 | fa7ee291-8dc8-4713-92c7-9027969e4aa1 | MFA | mkrwifi1010 |
| 2022-08-12 13:32:16 | /iot/v1/things/bc3b2763-a775-4fc8-95da-c03235d47f3a | bc3b2763-a775-4fc8-95da-c03235d47f3a | Thinking About You | 2 | 3a558c37-f087-47e9-8f01-339b40fc6dd9 | America/New_York | 2022-08-12 13:40:06 | fd39fa13-cbac-49ac-9316-cbdf452ba1c9 | NA | NA | NA | NA |
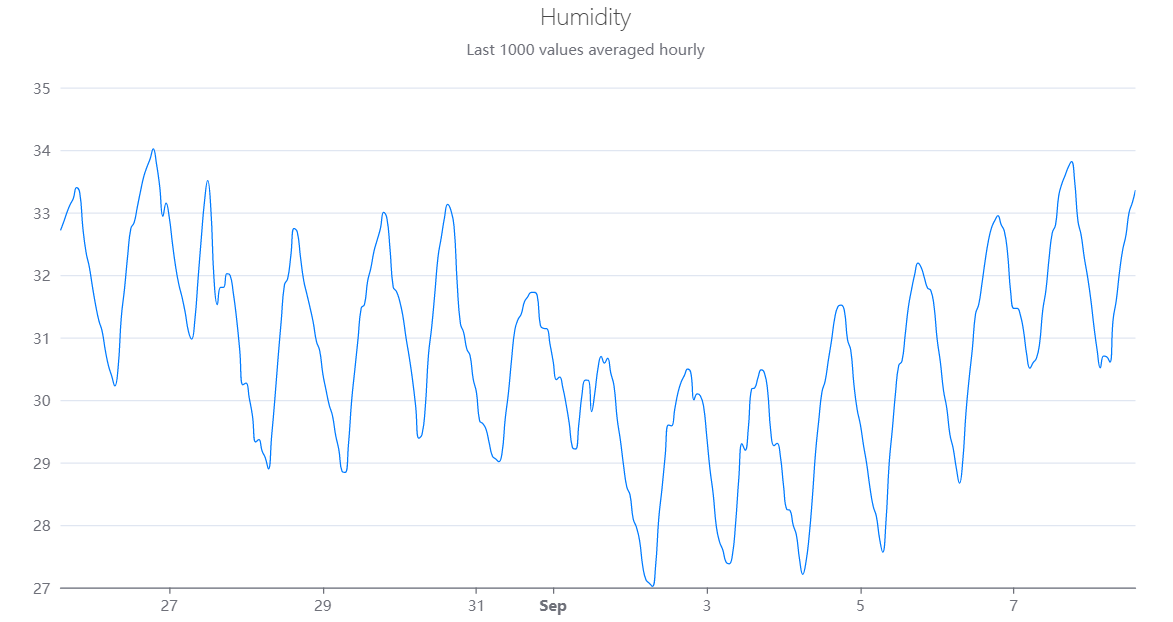
Reading real-time humidity sensor of one of your devices can be done as follow:
thing_id = "b6822400-2f35-4d93-b3e7-be919bdc5eba"
property_id = "d1134fe1-6519-49f1-afd8-7fe9e891e778" # Humidity

data_ts = things_properties_timeseries(thing_id = thing_id,
                                       property_id = property_id,
                                       desc = FALSE, interval = 3600)
#> v Method succeeded| time | value |
|---|---|
| 2022-08-30 09:00:00 | 31.92613 |
| 2022-08-30 10:00:00 | 32.28989 |
| 2022-08-30 11:00:00 | 32.59562 |
| 2022-08-30 12:00:00 | 32.91097 |
| 2022-08-30 13:00:00 | 33.12977 |
| 2022-08-30 14:00:00 | 33.03801 |
| 2022-08-30 15:00:00 | 32.78237 |
| 2022-08-30 16:00:00 | 31.85849 |
| 2022-08-30 17:00:00 | 31.22132 |
| 2022-08-30 18:00:00 | 31.08187 |
A catchy representation of humidity time series can be plotted, for instance, by using the library echarts4r by John Coene:
library(echarts4r)
library(dplyr)
library(lubridate)

data_ts = data_ts %>% mutate(time = with_tz(time, tzone = Sys.timezone()))

data_ts %>%
  e_charts(time) %>%
  e_line(value, name = "Value", color = "#007BFF", showSymbol = FALSE, smooth = TRUE,
         connectNulls = TRUE, animation = FALSE, emphasis = NULL,
         lineStyle = list(width = 1)) %>%
  e_title(left = 'center', text = "Humidity",
          subtext = "Last 1000 values averaged hourly",
          textStyle = list(fontWeight = 'lighter')) %>%
  e_grid(top = 70, right = 30, left = 50, bottom = 30) %>%
  e_x_axis(show = TRUE, type = "time") %>%
  e_y_axis(show = TRUE, scale = TRUE) %>%
  e_legend(show = FALSE)